
Setup Application Observability
Application Observability requires Grafana Cloud metrics generation, opt-in to enable it, and note there is a cost associated with using this feature.
Quickstart
For local development, follow the quickstart guide for the easiest and quickest way to get started with Application Observability.
Production
For production setups, follow the production guide to set up Application Observability with a data collector.
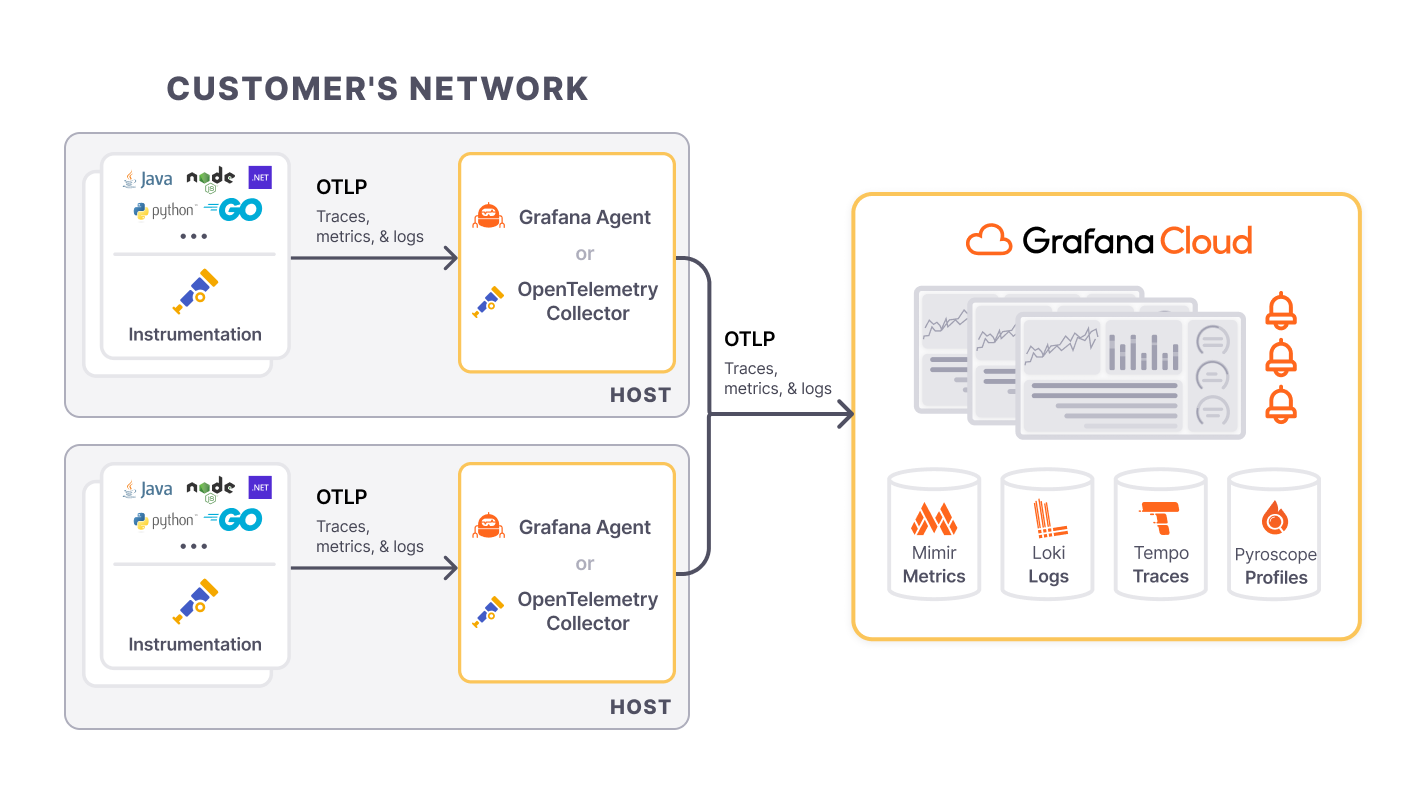
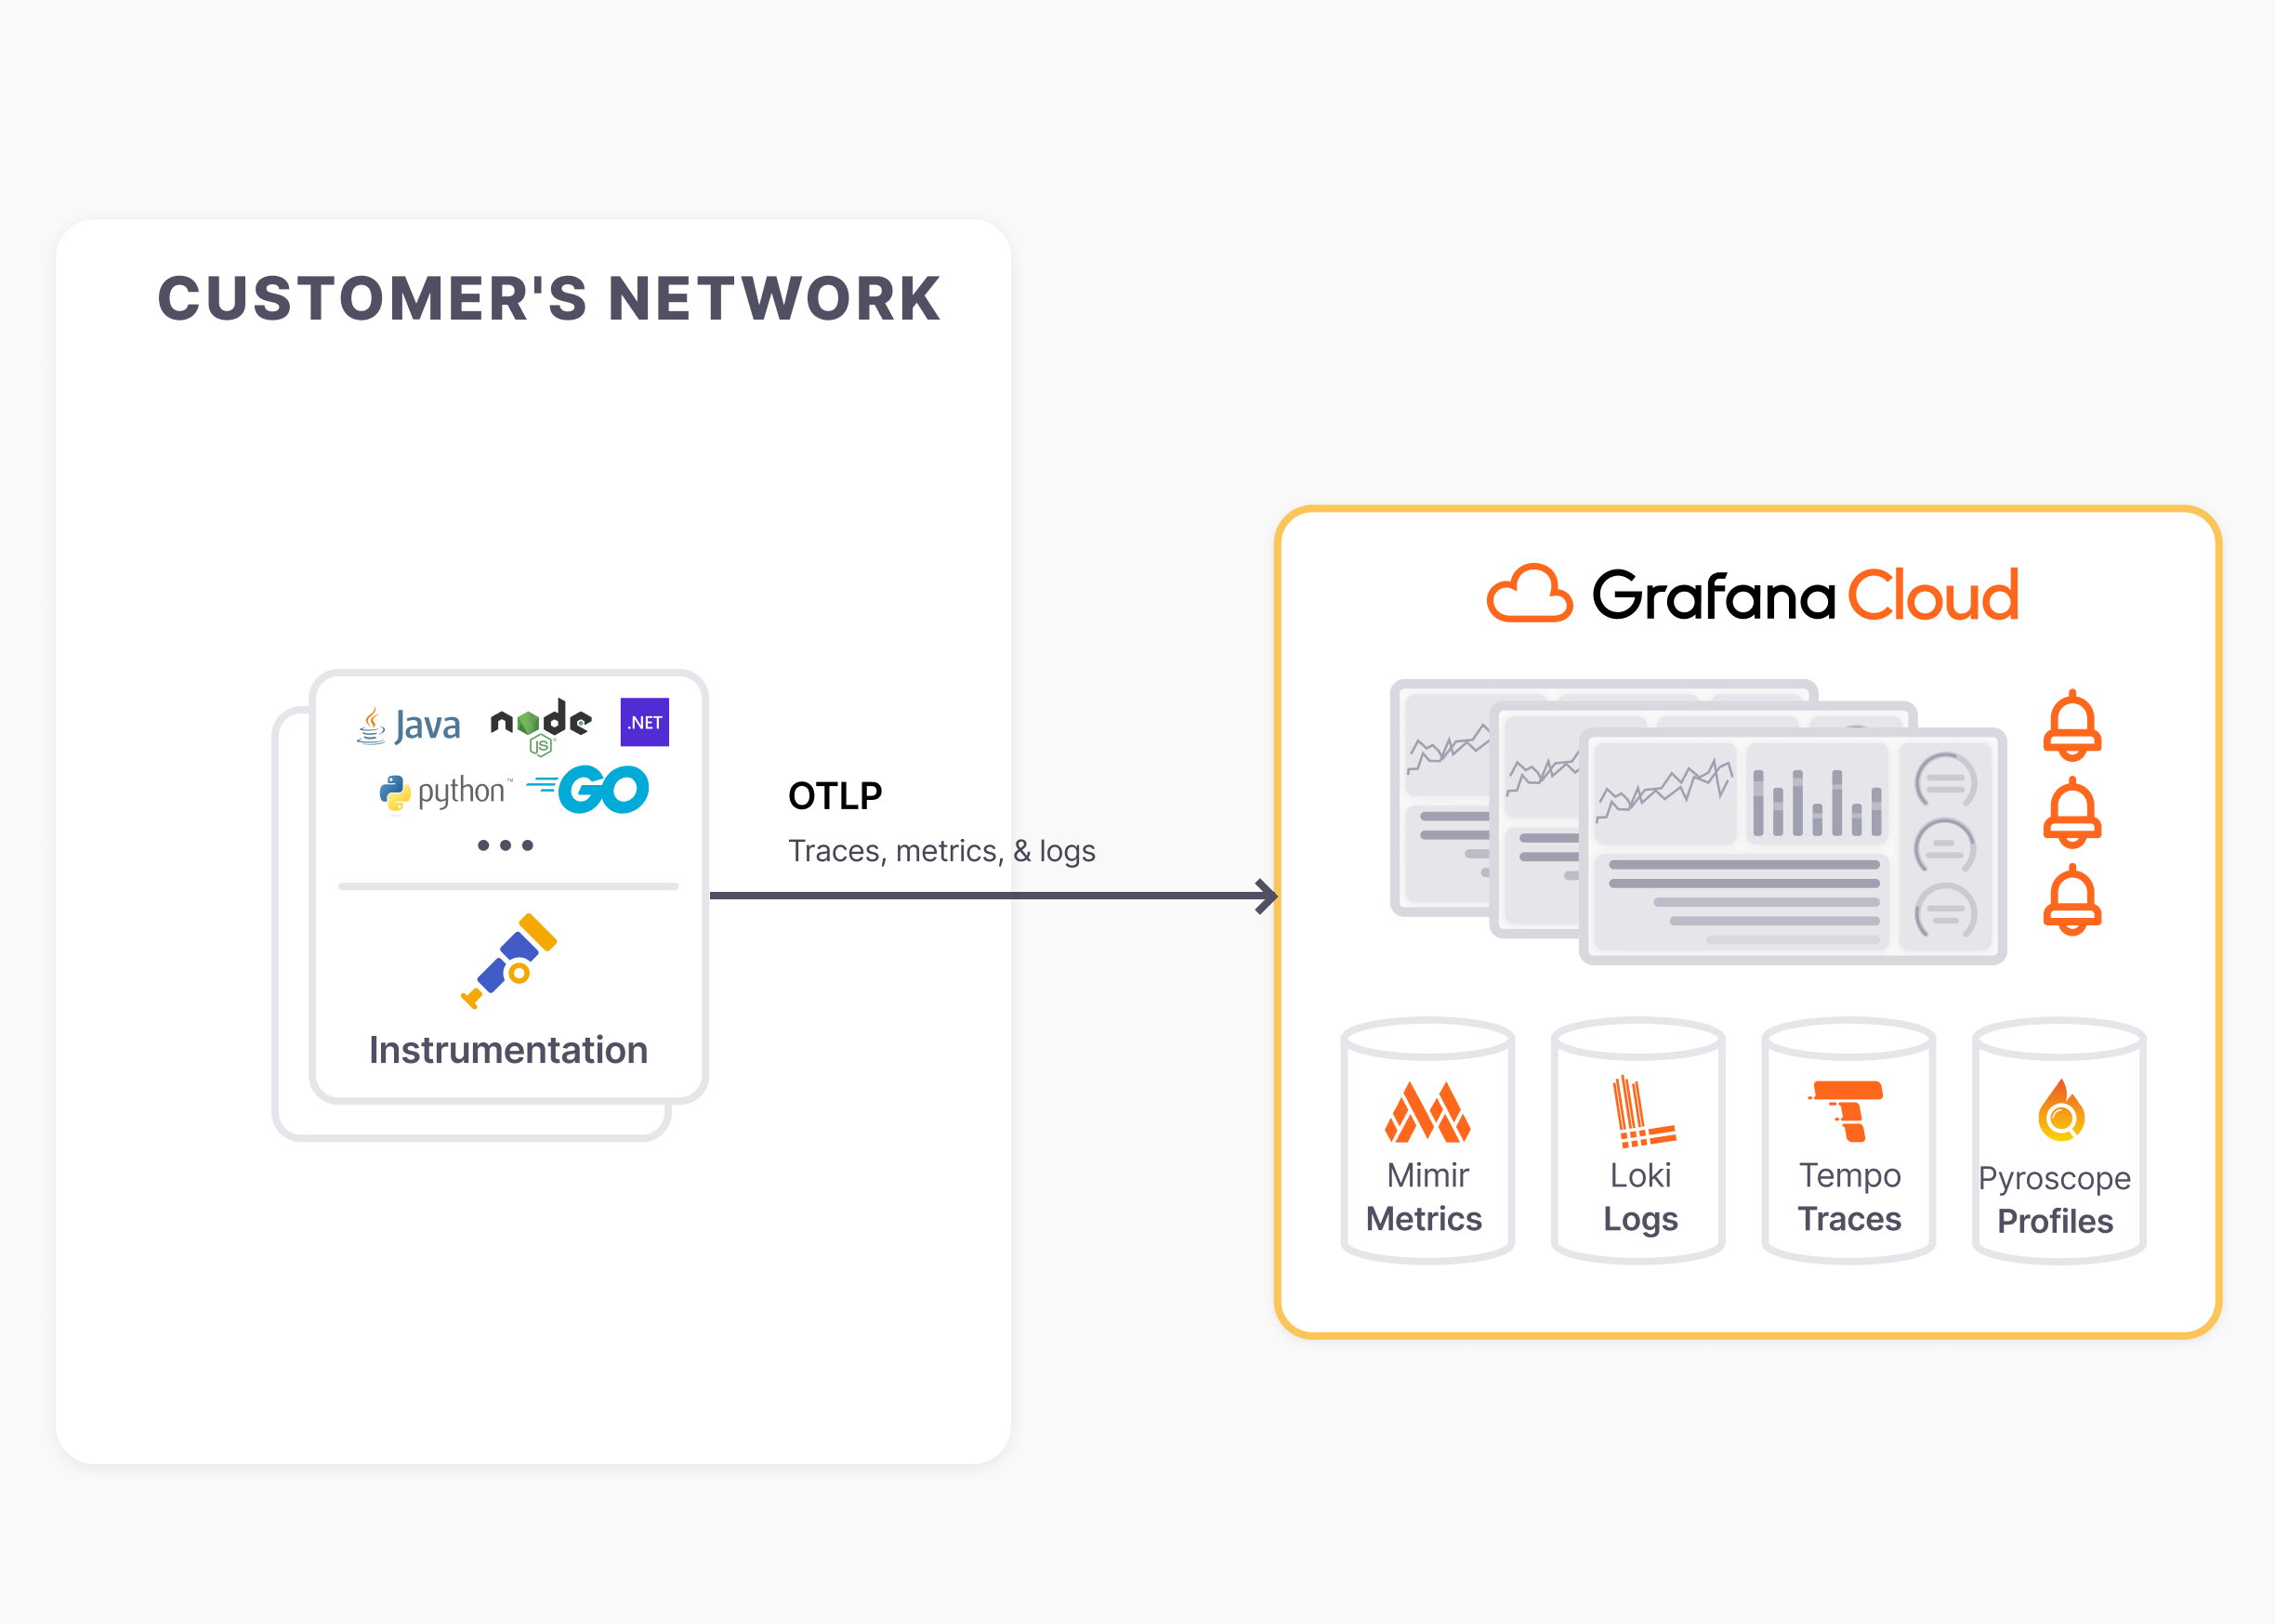
Collect and send telemetry data
Use the recommended Grafana Alloy data collector or the community supported OpenTelemetry Collector to send data to to the Grafana Cloud OTLP gateway.
Grafana Alloy
Consult the Grafana Alloy documentation for the recommended and supported way to send telemetry data for infrastructure and applications to Grafana Cloud.
OpenTelemetry Collector
Alternatively, consult the Grafana OpenTelemetry Collector documentation to use the community supported OpenTelemetry Collector to send telemetry data to Grafana Cloud.
Resource attributes
Refer to the resource attributes documentation for the recommended OpenTelemetry resource attributes for Application Observability.
Metrics generated
Grafana Cloud generates metrics from environment spans and service dependencies to create the dashboards and service map.
The following metrics are generated from traces to power the insights and workflows:
| Metric | Type | Labels | Description |
|---|---|---|---|
traces_service_graph_request_total | Counter | client, server, connection_type | The number of requests between two nodes |
traces_service_graph_request_failed_total | Counter | client, server, connection_type | The number of failed requests between two nodes |
traces_service_graph_request_server_seconds | Histogram | client, server, connection_type | The request time from the server |
traces_service_graph_request_client_seconds | Histogram | client, server, connection_type | The request time from the client |
traces_service_graph_unpaired_spans_total | Counter | client, server, connection_type | The number of unpaired spans |
traces_service_graph_dropped_spans_total | Counter | client, server, connection_type | The number of dropped spans |
traces_spanmetrics_latency | Histogram | Dimensions | The span duration |
traces_spanmetrics_calls_total | Counter | Dimensions | The count for the span |
traces_spanmetrics_size_total | Counter | Dimensions | The size of spans ingested |
Was this page helpful?
Related resources from Grafana Labs


